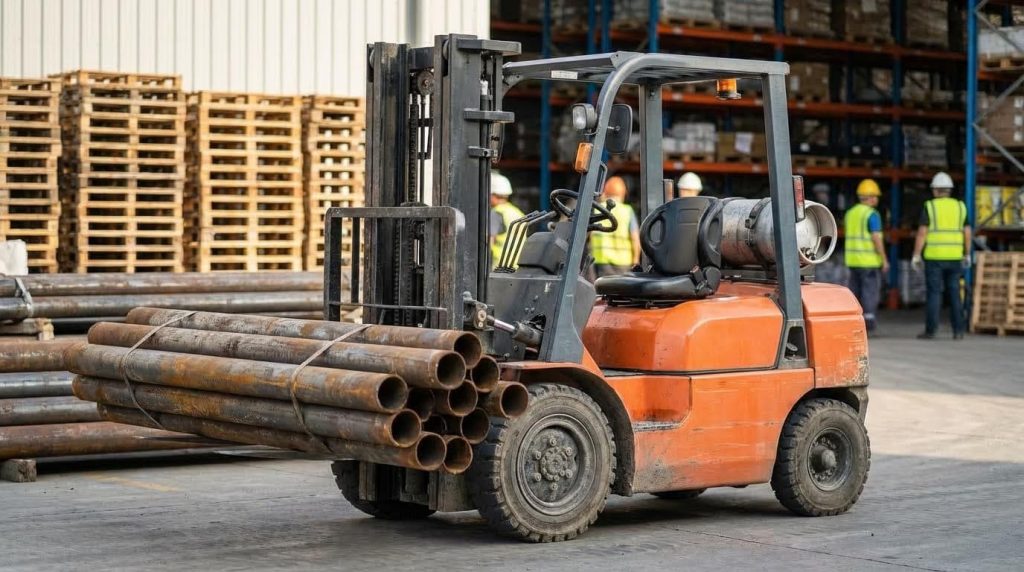
LPG-powered forklifts had become a core asset in warehousing, manufacturing, construction, and cold-chain logistics because they combined strong performance with relatively low operating cost. However, volatile propane prices, diverse duty cycles, and shifting emissions regulations made fuel budgeting and total cost of ownership analysis increasingly complex. This guide structured LPG forklift fuel economics from the ground up, covering global price drivers, regional cost structures, real-world consumption modeling, and fleet-level optimization techniques. It concluded with an engineering comparison of LPG against alternative powertrains, enabling data-backed decisions on technology mix and long-term cost strategy.
Key LPG Price Drivers And Regional Variations

LPG forklift fuel costs depended on global energy markets, local infrastructure, and site-level contracting strategy. Engineers needed to understand these drivers to budget accurately and evaluate LPG versus gasoline, diesel, or electric options. The following sub-sections broke down macro price formation, regional effects, cylinder-level economics, and non-obvious surcharges that affected true cost per operating hour.
Global Propane Markets And Price Volatility
Global propane prices historically tracked crude oil and natural gas liquids benchmarks. Supply disruptions, seasonal heating demand, and geopolitical events generated price spikes or discounts. For example, forklift-grade propane in the United States ranged from about 2.50 to 5.00 USD per gallon in 2025, depending on region and contract structure. Engineers therefore treated LPG price as a variable input in total cost of ownership models and ran sensitivity analyses over realistic price bands rather than a single static value.
Regional Fuel Pricing, Taxes, And Logistics
Geographical location strongly influenced delivered LPG cost through production proximity, transportation distance, and tax regimes. Regions with extensive natural gas processing and storage infrastructure, such as Texas, usually saw lower forklift LPG prices than remote areas like parts of Alaska or high-tax states. Urban congestion, road restrictions, and safety regulations increased logistics costs for cylinder exchange or bulk deliveries. When comparing LPG against electric or diesel options, engineers incorporated regional energy tariffs, road fuel taxes, and environmental levies to obtain an apples-to-apples operating cost comparison.
Cylinder Sizes, Fill Levels, And Cost Per Refill
Standard LPG forklift cylinders typically had nominal capacities near 33.5 lb and 43 lb, corresponding to approximately 8 gallons and 10 gallons of propane at the recommended 80% fill level. At a notional unit price of 3.50 USD per gallon, a 33.5 lb cylinder refill cost about 28 USD, while a 43 lb cylinder cost roughly 35 USD. Actual cost per operating hour depended on both cylinder price and forklift consumption rate, which often fell between 1 and 3 gallons per hour or about 6 lb of LPG per hour for internal combustion units. Engineering cost models therefore linked cylinder size, fill policy, and measured runtime per cylinder to derive accurate per-hour and per-shift fuel costs.
Hidden Charges: Rental, Demurrage, And Delivery
Invoice line items beyond the per-gallon LPG rate significantly affected effective fuel cost. Suppliers frequently applied cylinder rental fees, demurrage for holding cylinders beyond agreed periods, and minimum monthly charges that penalized low turnover. Delivery surcharges for small drops, off-hours service, or remote sites further increased the landed cost per liter or gallon. Engineers evaluating LPG forklift economics requested detailed quotations that separated fuel price, container charges, and logistics costs, then normalized these to a cost-per-hour or cost-per-pallet-moved metric for robust comparison with alternative power sources.
Calculating LPG Forklift Fuel Use And Hourly Cost
Engineering teams needed a structured method to translate LPG usage into reliable hourly and per-shift cost figures. This section explained how to characterize typical consumption, build traceable cost-per-hour calculations, and factor in real operating patterns. It also showed how to use fleet data and telematics to convert raw meter readings into actionable cost benchmarks. The goal was to support budget planning, TCO modeling, and data-driven fuel reduction programs.
Typical LPG Consumption Rates And Duty Cycles
LPG forklifts typically consumed 1–3 gallons of propane per operating hour. Lighter-duty warehouse work with low loads and short travel distances sat near 1 gallon per hour. Medium-duty applications with mixed lifting and frequent travel often averaged around 2 gallons per hour. Heavy-duty cycles with near-rated loads, high lift heights, and continuous operation approached or exceeded 3 gallons per hour.
Mass-based figures of about 6 pounds of LPG per hour aligned with mid-range consumption. Duty cycle characterization required separating idle, travel, lift, and high-load time fractions. Stop–start operation, rough floors, and frequent ramp use all increased burn rate. Older engines, poor tuning, and low-quality LPG further pushed consumption upward for the same duty cycle.
Step-By-Step Fuel Cost Per Hour Calculations
Calculating fuel cost per hour started with a known tank cost and accurate hour-meter readings. For example, if a 33.5 lb cylinder held about 8 gallons and propane cost €3.50 per gallon, a full refill cost approximately €28. Engineers then logged the hour meter when installing a full cylinder and again when it emptied. If the forklift ran 25 hours on that tank, the fuel cost per hour equaled €28 divided by 25, or €1.12 per hour.
The same method scaled to different prices and cylinder sizes. A 10-gallon (43 lb) tank at €3.50 per gallon cost about €35; if it lasted 20 hours, cost per hour was €1.75. For more precision, teams averaged multiple tank cycles to smooth operator and task variability. They then converted hourly cost into per-shift and annual figures based on actual utilization hours, not just calendar days.
Impact Of Load, Layout, And Operating Patterns
Load magnitude and handling profile strongly affected LPG burn rate. Near-capacity lifts to high racking heights demanded higher engine output and increased consumption per hour. Frequent short shuttle moves with repeated acceleration and braking also raised fuel use. Conversely, consolidated loads and fewer empty runs reduced total energy demand.
Facility layout played a direct role through travel distance and stop frequency. Long, indirect routes, poor staging zones, and congestion forced additional driving and idling. Ramps, uneven floors, and tight turns increased rolling resistance and engine load. Audits that mapped actual forklift paths often identified route optimizations and revised pick locations that cut fuel use without changing equipment.
Using Fleet Data And Telematics For Cost Tracking
Telematics systems allowed continuous tracking of hour meters, operating modes, and sometimes real-time LPG level or tank swaps. By linking each cylinder change or bulk refill to a specific truck and time window, managers built accurate fuel-per-hour and fuel-per-pallet metrics. They could separate productive lifting time from idle or key-on time to identify waste. Aggregated data across a fleet highlighted outliers with unusually high consumption, often pointing to maintenance issues or poor driving habits.
Integrating telematics data with purchasing records provided a closed-loop cost model. Fuel invoices supplied total liters or gallons and spend, while telematics supplied total operating hours and duty cycle mix. This combination enabled benchmarking between sites, shifts, and applications. It also supported scenario modeling, such as comparing LPG cost per hour against projected electric energy cost per hour for future fleet transitions. For instance, transitioning to electric high lift pallet truck solutions could offer significant savings in certain scenarios. Additionally, integrating tools like forklift drum grabber attachments can optimize material handling efficiency. Facilities using manual pallet jack systems might also benefit from electrification strategies.
Reducing LPG Fuel Spend Across The Forklift Fleet
Reducing LPG fuel spend required a structured approach across maintenance, operations, layout, and procurement. Engineering teams analyzed consumption drivers, then applied targeted interventions with measurable key performance indicators. The following subsections described practical levers that operations managers used to cut LPG cost per operating hour without sacrificing throughput.
Maintenance Practices That Improve Fuel Efficiency
Maintenance had a direct, quantifiable impact on LPG consumption and engine life. Well-maintained LPG forklifts used less fuel per hour and required fewer unplanned repairs, lowering total cost of ownership. Regular engine tuning, air filter changes, and ignition system checks ensured complete combustion and reduced wasted fuel. Keeping tires correctly inflated and replacing damaged tires minimized rolling resistance, which reduced engine load and LPG burn rate.
Using clean, specification-compliant LPG and maintaining regulators, injectors, and vaporizers helped stabilize fuel-air ratios. Data from field operations indicated that LPG forklifts required 20–30% fewer oil changes and experienced extended spark plug life compared with gasoline units, saving roughly USD 800–1,200 per truck annually. Planned preventive maintenance intervals based on engine hours, not calendar time, aligned service with actual duty cycles. Maintenance logs linked to fuel records allowed engineers to correlate tune-up quality with changes in liters per operating hour.
Operator Training And Behavioral Controls
Operator behavior strongly influenced real-world LPG consumption, often more than rated engine efficiency. Aggressive acceleration, hard braking, and unnecessary high-speed travel increased fuel use without improving throughput. Training programs therefore emphasized smooth acceleration, early deceleration, and minimizing idle time by shutting down trucks during breaks or extended pauses. In structured trials, operations that reduced idle and harsh driving reduced LPG consumption per hour by noticeable double-digit percentages.
Standardized operating procedures, such as defined parking and staging rules, reinforced fuel-efficient habits. Supervisors used hour-meter data and cylinder change logs to benchmark operators and shifts, then provided targeted feedback. Incentive schemes tied to safety and fuel performance, not just pallets moved, aligned operator goals with cost reduction. Simple visual cues, including posted best-practice checklists at charging and cylinder-change stations, helped maintain behavioral gains over time.
Facility Layout, Routing, And Workload Balancing
Facility design and task allocation significantly affected travel distance and lift cycles, and therefore LPG consumption. Poorly planned layouts forced trucks to travel longer routes, backtrack, or queue, increasing engine hours per unit of output. Engineers conducted flow audits, mapping actual forklift paths, racking heights, and pick frequencies to identify wasted motion. Repositioning high-turnover SKUs closer to shipping docks or production lines reduced average trip length and fuel use per pallet.
Optimized routing, such as one-way traffic patterns and dedicated aisles by task type, reduced congestion and stop-start driving. Workload balancing across trucks and shifts prevented over-utilization of a subset of forklifts, which otherwise accumulated hours faster and consumed disproportionate LPG. Simulation tools or simple spreadsheet models helped compare alternative layouts using metrics like meters traveled per pallet and liters of LPG per tonne handled. After layout changes, managers tracked LPG use per shift to verify that theoretical savings appeared in actual fuel invoices.
Contracting, Bulk Storage, And Price Risk Management
Fuel procurement strategy determined the baseline cost of each liter of LPG before any efficiency gains. Because global propane prices had fluctuated with crude oil, season, and regional logistics, fixed-price or indexed contracts with reputable suppliers reduced volatility. Buyers compared offers on a landed-cost basis, including taxes, delivery, and handling charges, not only posted price per liter. Where volume justified it, on-site bulk storage tanks lowered unit cost compared with frequent cylinder deliveries and reduced exposure to peak seasonal pricing.
Engineering and finance teams jointly evaluated cylinder exchange versus bulk-fill models, considering demurrage, rental, and delivery fees. Transparent contracts itemized these costs to prevent hidden charges that eroded savings from operational improvements. Some operations used staggered contract tenors or price caps to balance downside savings with protection against price spikes. Regular reviews of consumption data, contract terms, and market prices allowed companies to renegotiate or rebid supply before renewal, locking in favorable LPG costs that amplified the effect of maintenance and operational efficiency measures.
Summary: Comparing LPG Fuel Economics And Strategy
LPG forklifts offered a distinct balance of acquisition cost, operating cost, and performance. Purchase prices stayed roughly 20–30% below comparable electric units, while fuel and maintenance costs sat between diesel and electric alternatives. On a per-shift basis, LPG fuel expense typically exceeded electricity by a factor of about five, yet remained 30–40% cheaper per operating hour than gasoline. Over five years, total cost of ownership for a medium-duty LPG forklift generally ranged from USD 52,000 to 60,000, versus roughly USD 65,000 to 75,000 for gasoline units.
From an engineering and operations standpoint, LPG suited high-intensity, multi-shift, and cold-climate applications. Refueling took 2–5 minutes, supported 4–8 hours of runtime per cylinder, and avoided long charging windows. LPG engines delivered 15–20% higher torque than typical electric models and maintained stable output from −20 °C to 45 °C, with notably lower failure rates in cold storage than battery-powered trucks. At the same time, LPG technology met EU Stage V and US EPA Tier 4 requirements, with roughly 60% lower carbon monoxide emissions than gasoline and lower particulates than diesel, though lifecycle CO₂ remained higher than for electric units in low-carbon grids.
Strategic cost control relied on several levers. Fuel price management included negotiating indexed supply contracts, auditing invoices for hidden rental and demurrage fees, and evaluating on-site bulk storage where volumes justified the capital cost. Engineering controls focused on maintenance standards, tire condition, and engine tuning to cut consumption and extend engine life by 15–20%. Fleet managers used telematics, hour-meter logs, and cylinder tracking to calculate real fuel cost per hour and per tonne handled, then optimized duty cycles, routing, and operator behavior. In regions with high electricity tariffs or unreliable grids, LPG often remained the lowest-risk option; where power was cheap and clean, transitioning to electric fleets could yield payback in roughly 15 months. A balanced strategy evaluated site-specific duty profiles, energy prices, environmental constraints, and capital budgets before deciding whether to double down on LPG efficiency measures or gradually pivot toward electrification.