Understanding how much lift capacity you lose on pallet forks requires more than reading a nameplate rating. The complete article explains how load center, attachment geometry, and lift path change the effective capacity of loaders and telehandlers. It also examines stability limits, tipping behavior, and how operating conditions like slopes or rough ground further reduce safe loads. Finally, it covers attachment selection, maintenance, and modern monitoring systems that help engineers and operators manage manual pallet jack use safely and efficiently.
Load Center Basics And Capacity Derating
Load center distance governed how much lift capacity operators lost when switching from buckets to pallet forks. Understanding this relationship answered the practical question “how much lift capacity do you lose on pallet forks” in a quantitative way. Engineers evaluated the full loader or telehandler system, including attachment weight, geometry, and stability limits. This section explained the physics, compared common attachments, and walked through example capacity derating calculations for different fork lengths.
How Load Center Distance Reduces Capacity
Loaders and telehandlers behaved as lever systems around the front axle or stability triangle. The farther the load center moved forward from the loader pins, the larger the overturning moment became. Rated operating capacity usually referenced a specific load center, often 0.61 m, with the arms at a defined height and reach. When pallet forks pushed the pallet center of gravity from 0.61 m to 0.76 m, effective safe capacity dropped in proportion to the distance ratio. For example, a machine rated at 2 270 kg at 0.61 m reduced to about 1 820 kg at 0.76 m, before applying any additional safety factor. In practice, engineers applied extra derating, often 15–25%, to account for dynamic effects, uneven loads, and terrain.
Comparing Buckets, Forks, And Other Attachments
Buckets, forks, and specialized tools all changed the load center and attachment mass differently. A typical general-purpose bucket had a floor depth near 0.40 m, placing the material center of gravity about 0.20 m ahead of the bucket heel and close to the hinge pins. Pallet forks, by contrast, located the pallet center much farther forward, often 0.70–0.90 m from the pins for common fork lengths and pallet sizes. This shift explained why a skid steer that safely lifted 680 kg in a bucket dropped to roughly 440 kg with 1.07 m pallet forks. Grapples, bale spears, and clamps added significant attachment weight but sometimes kept the load center closer than long forks, so they could reduce hydraulic margin more than stability margin. Engineers compared attachments using two main variables: added mass on the quick-attach plate and the resulting horizontal distance from pins to the combined load center.
Vertical Vs. Radial Lift Loader Geometry
Vertical-lift loaders kept the load path closer to the machine through most of the lift arc. At full height, the hinge pin and therefore the pallet center stayed relatively near the front axle, which improved stability and preserved more usable capacity on pallet forks. Radial-lift machines followed an arc that projected the load farther forward at mid to full height. That geometry increased the overturning moment for the same pallet weight and fork length. As a result, operators lost more effective lift capacity on pallet forks with radial-lift units, especially when reaching into truck beds or hoppers. For tasks dominated by fork work at height, vertical-lift designs historically provided better “real-world” capacity, even when brochure ratings looked similar.
Example Calculations For Fork Length Changes
Capacity derating for fork length followed a simple moment ratio, which engineers used for quick estimates. Start with the rated operating capacity at the specified load center, then scale by the ratio of original to new load center distance. For instance, consider a loader rated 2 270 kg at a 0.61 m load center. If pallet geometry and 0.90 m forks placed the pallet center at 0.76 m, the theoretical static capacity became 2 270 × (0.61 ÷ 0.76) ≈ 1 820 kg. Applying a 20% operational safety margin reduced the recommended working load to roughly 1 450 kg. Historical field data showed similar patterns: a 680 kg machine with a bucket dropped to about 440 kg with walkie pallet truck, a reduction near 35%. Longer forks, for example moving from 0.86 m to 0.91 m, pushed the load center several centimetres forward and could remove another 5–10% of usable lift, depending on geometry and attachment weight.
Stability, Tipping Loads, And Operating Conditions
Understanding stability and tipping behavior is essential when evaluating how much lift capacity you lose on pallet forks. Loaders and telehandlers were rated under controlled conditions, with specific attachments, load centers, and terrain assumptions. Once you fit pallet forks and operate on real job sites, available lift capacity often drops well below the nameplate rating. Engineers and operators must link rated operating capacity, tipping loads, and operating conditions to real fork work.
Rated Operating Capacity, Tipping Load, And Safety Margins
Manufacturers defined rated operating capacity as a fraction of the tipping load at a specified load center. Wheeled skid steers typically used 50% of tipping load, while tracked machines used about 35%. This safety factor accounted for dynamic effects, uneven loading, and operator variability. When you add pallet forks, you move the load center forward and effectively reduce the tipping load and therefore the usable capacity.
Consider a loader rated for 5,000 kg ROC at a 600 mm load center. If a pallet places the center of gravity at 750 mm, the theoretical static capacity becomes 5,000 × (600/750) ≈ 4,000 kg before additional safety margins. Realistic safe capacity may drop another 15–25% when you include dynamic effects and regulatory margins. Historic data showed a 1,500 lb ROC skid steer dropping to about 975 lb with long forks, a reduction of roughly 35%. This illustrates how quickly lift capacity can fall once forks extend the load center.
Terrain, Slopes, And Dynamic Load Effects
Terrain and motion strongly influence how much lift capacity you lose on pallet forks. Rated capacities assumed level, firm ground with the machine stationary. Field conditions rarely matched this ideal. A slope of about 5° could reduce stability by roughly 30%, especially when the load center was already extended by long forks. Side slopes were particularly critical because they shifted the combined center of gravity toward the downhill side.
Dynamic effects further eroded usable capacity. Braking, accelerating, or hitting ruts caused load inertia to pitch the machine forward. With pallet forks, the load sat higher and further out, which amplified this pitching moment. Engineers therefore recommended operating well below the theoretical static capacity when travelling, especially with the load raised. Keeping the pallet low, travelling slowly, and avoiding sudden control inputs helped maintain a safe stability margin.
Hydraulic Limits Vs. Stability Limits
Hydraulic capacity and stability did not always limit the machine at the same time. Hydraulic systems had maximum pressure and flow that defined the theoretical lift force at the cylinders. Stability limits depended on tipping load and geometry. With pallet forks and long load centers, stability usually became the first limit at low heights. However, in high-reach positions, hydraulic limits could dominate, especially on compact telehandlers and loaders.
For example, a loader might have enough hydraulic force to lift 4,000 kg at ground level but only 2,500 kg at full height with the boom fully extended. When you added 42-inch forks and reached into a truck bed, the effective load center increased and the cylinder leverage worsened. In some cases, the hydraulics could not raise a load that was still technically within the static ROC. Altitude, worn pumps, and internal leakage further reduced available hydraulic force by several percent, narrowing the margin between hydraulic and stability limits.
Recognizing Overload And Near-Tip Conditions
Operators needed reliable cues to identify overload or near-tip situations when using pallet forks. Early signs included rear wheels becoming light or lifting off the ground on wheeled machines. Steering felt vague, and small bumps caused noticeable pitching. Loader arms might raise slowly, jerk, or stall partway, indicating that hydraulic demand approached or exceeded system capability. Unusual pump noises or relief-valve hissing also signaled overload conditions.
Modern machines incorporated sensors and warning systems to detect these states earlier. Load moment indicators monitored boom angle, extension, and hydraulic pressure to estimate the current load relative to tipping limits. Some systems automatically derated ROC when they detected instability, particularly with long forks or extended booms. Operators still had to read load charts, respect rated operating capacity, and avoid guessing how much lift capacity they had lost on manual pallet jack. Consistent pre-use checks, conservative loading practices, and attention to machine behavior remained essential to prevent tip-overs and structural failures.
Attachment Selection, Maintenance, And Smart Systems
Attachment choice and upkeep directly answer the question “how much lift capacity do you lose on pallet forks.” Engineers must consider fork geometry, attachment mass, structural condition, and control systems together. This section explains how fork dimensions, inspection practices, and digital monitoring combine to manage capacity derating on loaders and telehandlers.
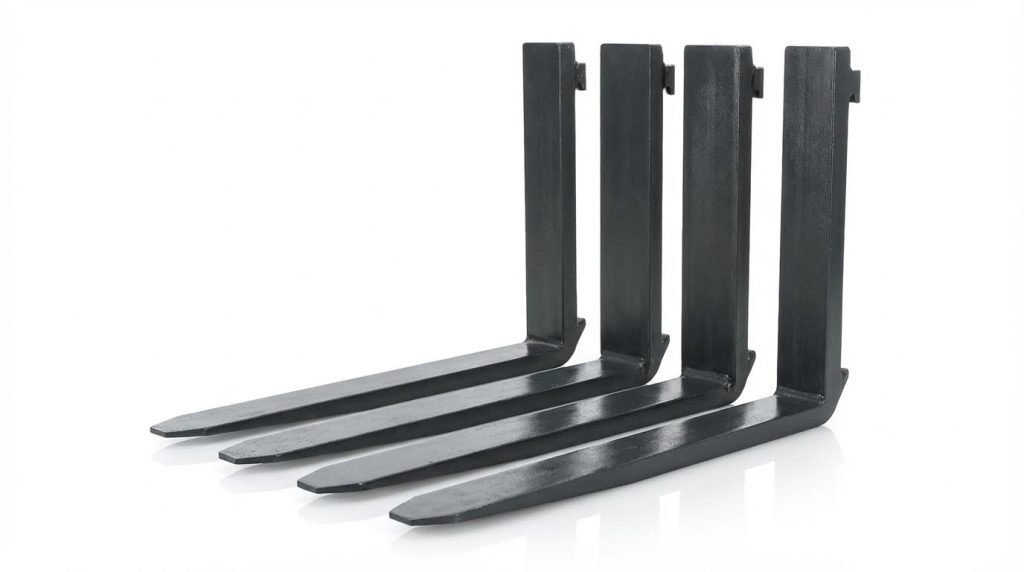
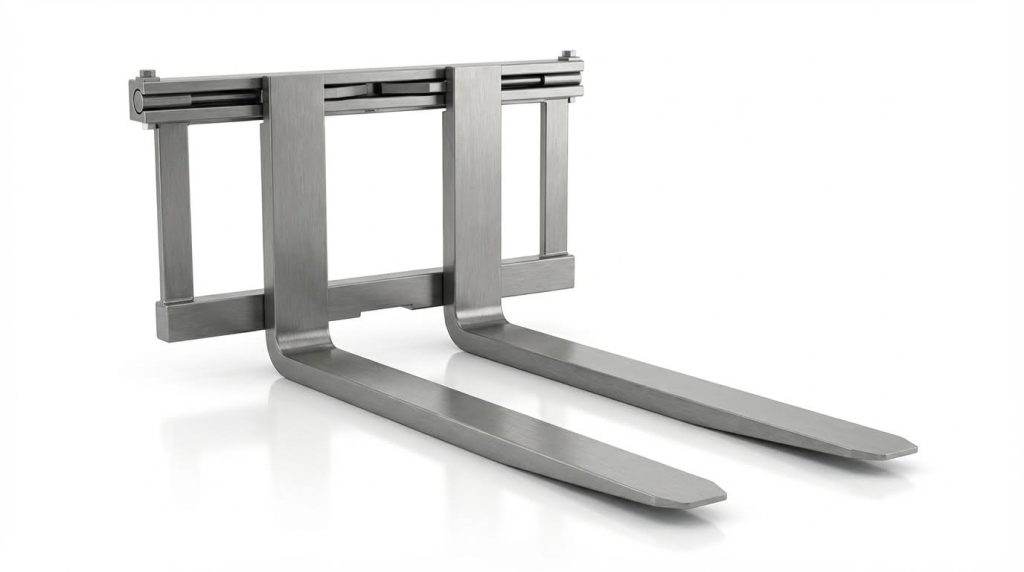
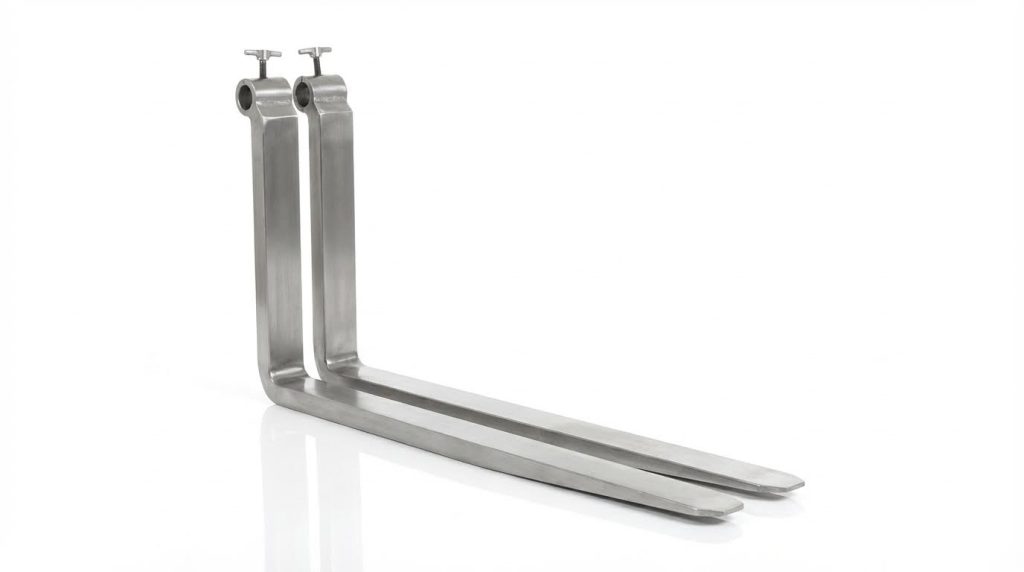
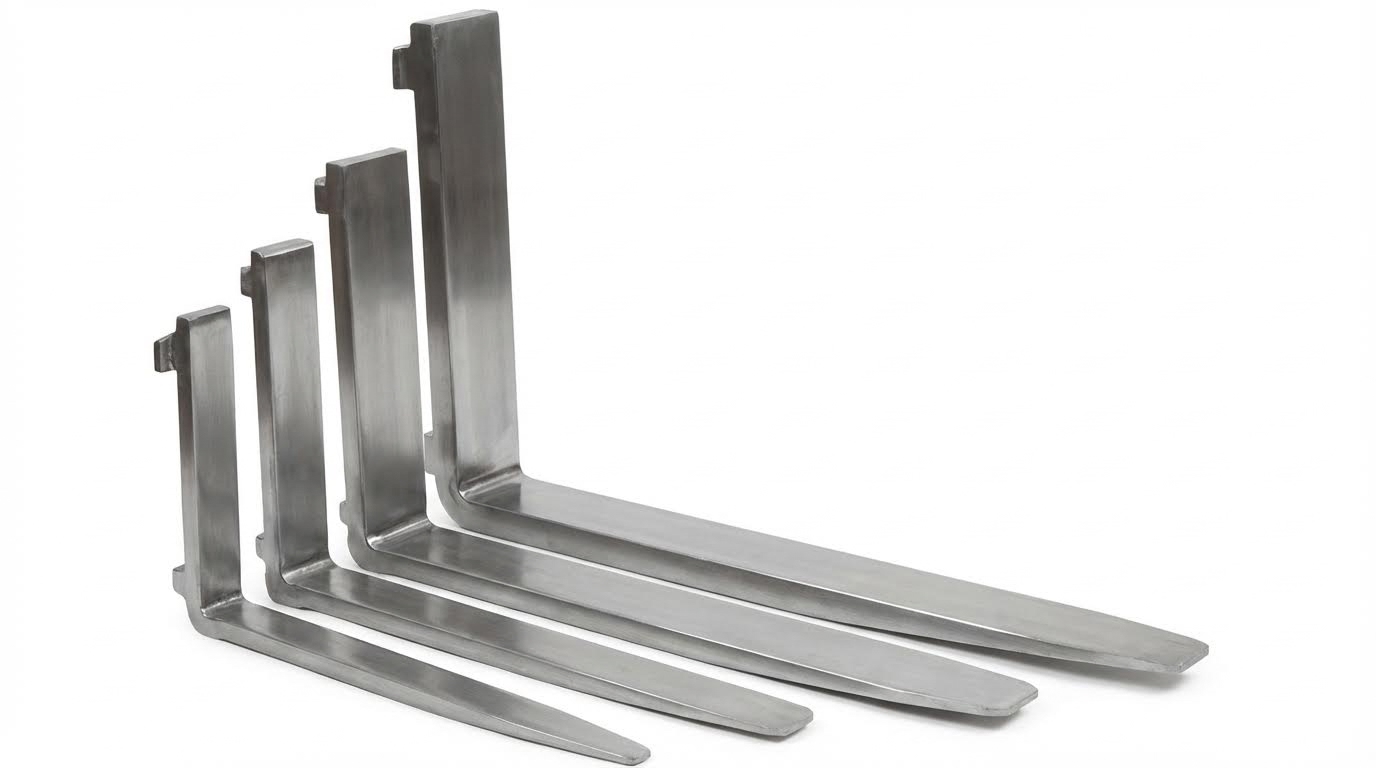
Fork Length, Section Size, And Attachment Weight
Fork length strongly affects how much lift capacity you lose on pallet forks because it changes the load center distance. Capacity varies approximately inversely with load center, so increasing the distance from 0.61 m to 0.76 m can derate capacity by about 20%. For example, a loader rated 2 270 kg at a 0.61 m load center might safely handle only about 1 820 kg at 0.76 m, before applying extra safety margins. Historical data showed a skid steer that lifted 680 kg with a bucket dropped to about 442 kg with 1.07 m forks, a reduction of roughly 35%. Fork section size also matters because thicker, higher-grade steel sections resist bending at higher stresses, allowing the fork manufacturer to certify a higher safe working load at a standard load center, typically 0.5 m. However, heavier forks and carriage frames subtract directly from the machine’s rated operating capacity. If the machine ROC is 2 500 kg and the fork carriage weighs 250 kg more than a bucket, the available payload already falls to 2 250 kg before any load-center derating. Engineers therefore balance fork length for reach against capacity loss, and specify the lightest section that still meets deflection, fatigue, and impact requirements.
Inspection, Wear Criteria, And Service Intervals
Regular inspection limits unexpected capacity loss due to hidden damage or wear. Bent forks, cracked welds, or worn heels shift the effective load path and reduce the real-world safety margin below the nameplate rating. Industry practice required removing forks from service when heel thickness wore by 10% from original, because this reduced section modulus and fatigue strength significantly. Daily walk-around checks focused on cracks at the heel radius, distorted blades, damaged locking pins, and loose carriage hooks. At 100-hour or weekly intervals, technicians measured heel thickness, checked fork alignment, inspected hoses and couplers on hydraulic attachments, and verified that safety labels remained legible. At 2 000 operating hours, service procedures typically included checking cylinder seals, non-destructive testing of critical welds, and replacing highly stressed pins. After any repair, operators cycled the attachment through several full lift and tilt motions under light load to verify correct function. Consistent inspection and adherence to service intervals preserved the designed lifting capacity and reduced the probability of sudden fork failure under near-limit loads.
Digital Monitoring, Sensors, And Predictive Maintenance
Smart systems answered how much lift capacity you lose on pallet forks in real time instead of relying only on static charts. Load moment indicators measured hydraulic pressure, boom angle, and extension to estimate actual load and overturning moment at the current load center. Some systems auto-derated rated operating capacity when sensors detected longer forks, offset loads, or boom positions that increased instability. In practice, this meant the machine might limit lift to 3 200 kg even though the base ROC was 4 000 kg, because the pallet center of gravity sat 0.75 m from the fork heel instead of the rated 0.61 m. IoT sensors tracked duty cycles, overload events, and shock loads, then fed data to predictive maintenance algorithms. These models identified patterns such as repeated near-tip events, which accelerated fatigue in loader arms, carriages, and forks. Remote dashboards allowed fleet managers to compare theoretical capacity loss from geometry with observed hydraulic performance, including altitude-related derating of roughly 3% per 300 m. Integrating these data-driven tools helped engineers refine attachment choices and maintenance plans to maintain safe capacity over the machine’s life.
Integrating Pallet Forks In Modern Material Handling
Integrating pallet forks into loader and telehandler fleets required a system-level view of capacity rather than treating forks as simple accessories. Engineers matched fork ratings, lengths, and carriage classes to each base machine’s ROC, typical pallet sizes, and required reach heights. Load charts and operator training emphasized that forks moved the pallet center farther forward than buckets, so practical capacity often dropped by 20–35% at full height compared with the brochure rating. Modern sites combined forks with load-stabilizing backrests, restraint bars, and standardized pallet dimensions to keep the center of gravity as close to the carriage as possible. Digital load monitoring and tilt sensors supported safe work on grades, where a slope above about 5° could reduce stability by roughly 30%. Integration also covered workflow: specifying dedicated fork machines for racking and truck loading, while assigning bucket-equipped loaders to digging and bulk handling. By treating manual pallet jack, machines, and smart systems as a unified material handling platform, operators maintained productivity while controlling how much lift capacity they lost on pallet forks in daily operations.
Practical Summary And Engineering Conclusions
When engineers ask “how much lift capacity do you lose on pallet forks,” the correct answer is always: it depends on load center, attachment weight, and stability limits, not just the nameplate rating. Pallet forks moved the load center forward relative to a bucket, so loaders and telehandlers consistently lost usable capacity compared with their published ratings at the hinge pin or standard load center. Field data showed capacity drops of roughly 25–40% when operators switched from a short bucket load center to long pallet forks, especially with 900–1,100 mm fork lengths and tall pallets. Vertical‑lift loader geometries kept the load closer to the machine at height and therefore preserved more capacity at full reach than radial‑lift designs.
From an engineering standpoint, capacity loss on pallet forks followed a simple moment balance: allowable load scaled roughly with the ratio of rated load‑center distance to actual pallet center‑of‑gravity distance. For example, a machine rated 2 270 kg at 610 mm effectively dropped to about 1 800 kg at 760 mm, and further down once a realistic safety margin of 15–25% was applied for dynamic effects, slopes, and wear. Terrain slopes above about 5° and rough ground reduced the practical safe load by roughly one‑third, even when the static load chart suggested the lift was possible. Hydraulic limits sometimes prevented lifts that were still inside the stability envelope, particularly at high reach or when using long forks to pick from truck beds.
In practice, the safest method to estimate how much lift capacity you lose on pallet forks combined manufacturer load charts, simple moment‑arm calculations, and conservative derating for real‑world conditions. Engineers should treat the rated operating capacity as a best‑case value on level, firm ground with a standard attachment and new hydraulics, then subtract capacity for longer forks, heavier attachments, off‑center loads, and degraded components. Digital load‑moment indicators, tilt sensors, and smart monitoring systems already provided real‑time feedback on center of gravity and approach‑to‑tip, and these systems would continue to evolve toward predictive, data‑driven derating rather than fixed paper charts. The balanced approach was to respect regulatory requirements, use quantitative derating, and design operating procedures that assumed lower, not higher, lift capacity whenever pallet forks extended the load center away from the machine.