Warehouse picking performance directly shaped operating cost, service levels, and labor productivity across modern facilities. This article examined how to define warehouse pick rate and core KPIs, engineer realistic but ambitious targets, and apply layout, process, and technology levers to lift picks per hour. It used industry benchmarks for picks, lines, and orders per hour, plus accuracy and cost metrics, to frame practical performance ranges from manual to robotic operations. Finally, it linked design choices, workforce strategy, and digital tools so operations teams could set coherent targets and build a roadmap to reach them.
Defining Warehouse Pick Rate And Core KPIs

Defining warehouse pick rate and its related KPIs required precise terminology and consistent measurement. Operations teams relied on these metrics to understand true performance, benchmark against peers, and justify investments. A clear KPI framework linked engineering decisions, labor planning, and technology choices to concrete service levels and costs. This section described the core indicators that structured high-performance picking operations.
Picks, Lines, And Orders Per Hour Explained
Picks per hour (PPH) measured individual item picks completed in one labor hour. It captured raw handling productivity and directly influenced labor cost per pick. Typical manual operations achieved 80–120 PPH, while optimized facilities with automation reached 200–300 PPH with robotic assistance. Lines per hour (LPH) counted distinct order lines processed, which reflected order complexity better than raw picks. Experienced pickers usually reached 60–85 LPH, while new staff stayed near 35–50 LPH until trained. Orders per hour indicated how many customer orders a picker or cell completed per hour, varying strongly with average order size. Operations with single-line orders often reached 40–60 orders per hour, while multi-line B2B orders typically stayed below 20 orders per hour.
Accuracy, Damage Rate, And Cost Per Pick
Pick accuracy rate quantified the percentage of order lines picked correctly on the first attempt. Manual processes typically operated between 97% and 99% accuracy, while pick-to-light and voice technologies pushed accuracy above 99.5%. Best-in-class order picking accuracy reached at least 99.9%, which sharply reduced returns, rework, and customer complaints. Damage rate measured the proportion of units damaged during picking and handling, with a robust target below 0.5%. Values above 1% signaled issues with equipment, training, packaging, or ergonomics. Cost per pick combined labor, systems, and overhead into a single financial KPI. Manual environments typically ranged from USD 0.75–1.25 per pick, semi-automated systems from USD 0.45–0.75, and highly automated systems from USD 0.25–0.45. Tracking cost per pick alongside accuracy ensured that productivity gains did not erode quality.
Travel Time, Utilization, And Capacity Benchmarks
Travel time percentage represented the share of a picker’s shift spent walking or driving rather than physically picking. Poorly designed layouts often showed 40–60% travel time, while optimized slotting and pick paths targeted 25–35%. High travel shares indicated opportunities for layout redesign, batch strategies, or goods-to-person concepts. Picker utilization rate measured productive picking time versus total paid time. Standard operations targeted 75–85% utilization, while tightly engineered sites aimed for 85–95% without compromising safety. Capacity-related KPIs tracked how effectively the building and storage systems supported pick performance. Storage location utilization ideally stayed between 80% and 90% to balance density with accessibility. Average warehouse capacity used around 80–92% and peak capacity near 95–100% indicated well-sized facilities without chronic congestion.
Manual, Semi-Auto, And Robotic Performance Ranges
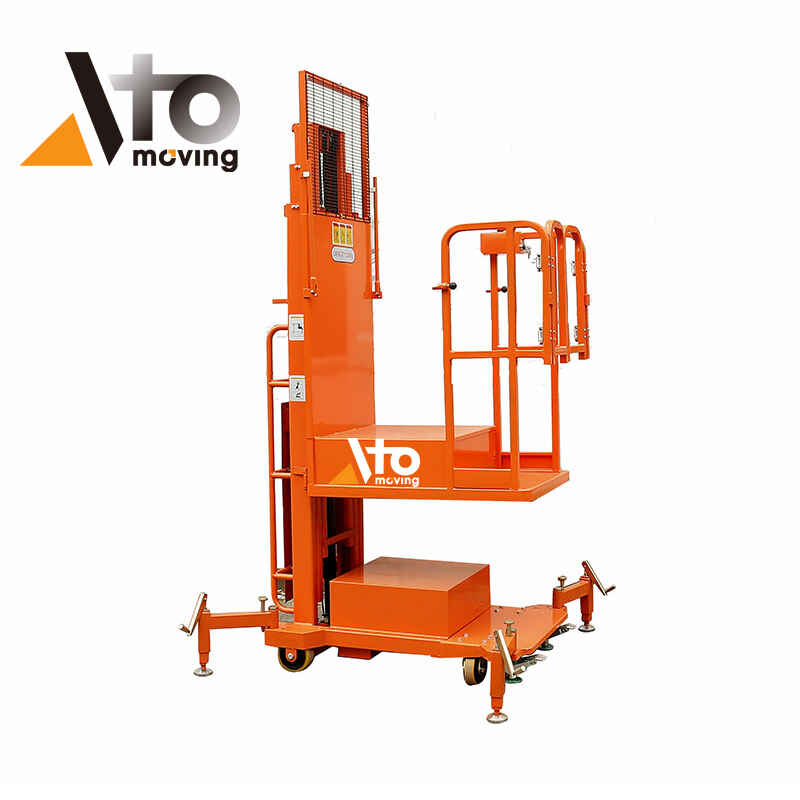
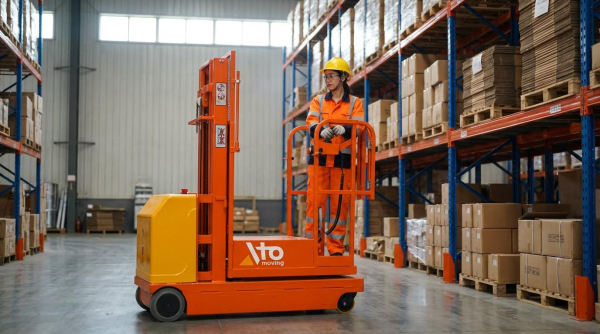
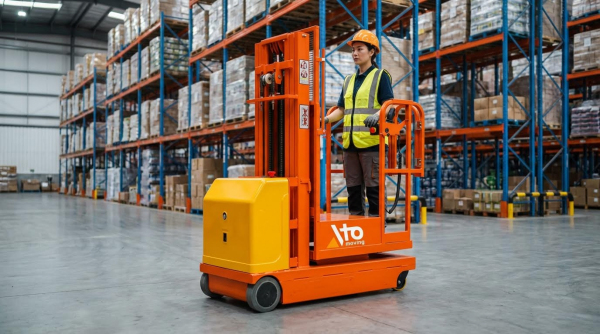
Manual picking relied on paper lists or basic RF scanning and formed the baseline for performance comparisons. Typical manual PPH ranged from 80 to 120, with pick accuracy near 97–99% when processes were controlled. Semi-automated operations used technologies such as pick-to-light, voice picking, and conveyor-fed zones. Pick-to-light systems usually delivered 150–200 PPH with 99.5–99.8% accuracy, while voice systems achieved roughly 120–160 PPH with 99.2–99.6% accuracy. Highly automated and robotic environments, including goods-to-person systems and robotic assistance, pushed PPH into the 200–300 range per operator-equivalent. Some automated solutions reported up to 550 lines per hour in specialized configurations. These higher rates typically coincided with lower cost per pick and more stable accuracy, but required careful justification through volume, SKU profile, and service-level requirements. For operations seeking advanced solutions, warehouse order picker systems and order picking machines offered significant improvements. Additionally, integrating tools like the scissor platform lift enhanced efficiency in high-density storage environments.
Engineering Pick Rate Targets For Your Facility
Engineering pick rate targets required linking commercial objectives to measurable, line-level performance. Facilities translated service-level, cost-per-order, and capacity requirements into explicit picks per hour and lines per hour expectations. Robust targets considered layout, technology level, order profile, and workforce structure, not just generic benchmarks. This section explained how to derive realistic targets, validate them with audits, and adapt them for different labor groups and peak seasons.
Translating Strategy Into PPH And LPH Targets
Translating strategy into PPH and LPH started with the required order cycle time and on-time shipment targets. Planners used benchmark ranges, such as 80–120 PPH for manual operations and 150–200 PPH for warehouse order picker, as reference bands rather than fixed goals. They back-calculated required PPH and LPH from forecast order volumes, average lines per order, and available labor hours. For example, if demand required 1,000 lines picked in an hour with 10 active pickers, the engineered target became 100 LPH per picker. Engineers then validated this against travel distances, technology stack, and accuracy requirements, ensuring that cost-per-pick and error-rate benchmarks remained acceptable.
Using Baseline Audits And Value Stream Mapping
Baseline audits established the current-state pick rate, accuracy, and travel-time profile before setting new targets. Teams measured actual PPH, LPH, order cycle time, pick accuracy, and travel time percentage, which often reached 40–60% in unoptimized sites. Value stream mapping visualized every step from order release to ship-confirm, highlighting queues, rework loops, and non-value-adding travel. In one documented case, a facility improved from 15 to 50 lines per hour over two years by systematically removing waste identified in such analyses. Engineers used these findings to set staged targets, for example moving from 35 to 50 LPH in six months, then to 60–70 LPH with layout and process changes.
Setting Tiered Targets For New, Temp, And Core Staff
Tiered targets reflected the different capabilities and ramp-up profiles of new, temporary, and core staff. Data showed new workers typically achieved 35–50 lines per hour, while experienced pickers reached 60–85 LPH under manual regimes. Facilities defined separate performance curves, for example expecting new hires to reach 80% of core staff LPH within 7–14 days, depending on process complexity. Temporary workers often ran 20–40% below permanent staff, so planners adjusted staffing models and did not size capacity assuming full parity. Transparent visual targets on boards or dashboards helped lower performers converge toward average levels, as one site demonstrated by lifting average output from 30 to 60 lines per hour in six months.
Peak Season, OT, And Workforce Mix Considerations
Peak season planning required stress-testing pick rate targets against higher order volumes while maintaining accuracy and on-time delivery benchmarks. Best-in-class operations retained 80–90% of normal productivity during peaks, while keeping overtime below approximately 8–9% of total hours for typical performers and under 2% for top-tier sites. Engineers modeled workforce mix, balancing core staff, overtime, and temporary labor to protect picker utilization in the 75–85% range under normal conditions and up to 95% in short peaks. They also checked that labor cost as a percentage of revenue remained within typical ranges, such as 8–15% for e-commerce. Scenario analysis with different mixes of manual, semi-automated, and automated zones allowed realistic peak targets that did not compromise safety, ergonomics, or damage-rate thresholds below 0.5%. For instance, using tools like scissor platform lift or walkie pallet truck could enhance efficiency during high-demand periods.
Design And Technology Levers To Lift Pick Rate

Design and technology choices directly constrained or enabled achievable pick rates. Engineering-led interventions targeted travel, accuracy, and variability because these drivers dominated cost per pick and order cycle time.
Layout, Slotting, And Pick Path Optimization
Engineers treated layout as a travel-time problem because travel historically consumed 40–60% of picker time in poorly organized facilities. They placed high-velocity SKUs in golden zones near dispatch and at ergonomic heights, which cut walking distance and reduced fatigue. Slotting rules used real demand data, grouping SKUs by velocity, affinity, and packaging constraints to minimize re-handling and carton changes. Modern WMS tools, including digital twin simulations, modeled alternative layouts and pick paths, showing that optimized routes could reduce travel-time share to 25–35% while improving lines picked per hour.
Batch, Wave, And Zone Picking Strategy Selection
Operations selected picking strategies based on order profile, SKU count, and service levels, because no single method fit all environments. Batch picking consolidated multiple small orders into a single route, cutting trips and raising productivity when SKUs overlapped, but required robust sorting and verification to protect accuracy. Wave picking scheduled groups of orders around carrier cut-offs and capacity constraints, improving on-time-ready-to-ship performance and smoothing dock utilization. Zone picking limited picker movement to defined areas, reducing congestion and distance, and worked well when supported by suitable carts, platform trucks, or tugger trains that enabled rapid transfer between zones without increasing handling damage.
WMS, Digital Twins, And Real-Time Data Analytics
Facilities used WMS as the control layer for pick logic, location management, and task interleaving, ensuring full product traceability and guided workflows. Integration with ERP allowed automatic order release and two-way status updates, which shortened internal order cycle time and reduced manual data errors. Digital twin capabilities inside advanced WMS platforms simulated layout, slotting, and labor scenarios, quantifying the impact of design changes on picks per hour and cost per pick before physical changes occurred. Real-time analytics dashboards tracked KPIs such as PPH, lines per hour, pick accuracy, travel-time percentage, and scanner first-pass read rate, enabling supervisors to detect bottlenecks early and adjust labor, paths, or batching rules in shift.
Automation, Cobots, And Goods-To-Person Systems
Automation projects focused on eliminating non-value-adding travel and stabilizing performance rather than chasing maximum theoretical speed. Goods-to-person systems used conveyors, shuttles, or vertical lift modules to bring totes to pickers, which historically increased lines picked per hour and reduced picker travel to near zero. Cobots and robotic pick-assist solutions handled repetitive moves or simple grasp tasks, allowing human workers to focus on exception handling and complex SKUs while maintaining pick accuracy above 99%. Engineers evaluated each automation option against benchmarks for cost per pick, peak-season performance retention, and damage rate, ensuring that capital investments aligned with required throughput and service-level objectives.
Ergonomics, Safety, And Predictive Maintenance
Ergonomics and safety improvements protected throughput by reducing fatigue, injuries, and unplanned downtime. Designers positioned high-consumption SKUs between knee and chest height, used carton-flow or gravity racks for piece picking, and created ergonomic workstations with all tools within easy reach. Clear signposting, adequate LED lighting, and well-marked travel lanes reduced incidents and mispicks, supporting pick accuracy targets near or above 99%. Predictive maintenance, driven by sensor data and analytics, forecasted failures on conveyors, lifts, and handling equipment, which allowed planned interventions during low-load windows and preserved system availability and stable picks-per-hour performance over time.
Summary: Aligning Design, Targets, And Technology
Warehouse picking performance depended on clear targets, disciplined execution, and fit-for-purpose technology. Operations that defined explicit picks-per-hour and lines-per-hour goals, aligned with strategy and order profiles, reduced cost per pick and improved service reliability. Facilities that treated pick accuracy, damage rate, and on-time readiness as equal partners to speed achieved best-in-class benchmarks above 99.5% accuracy and near 100% on-time shipment.
Engineering realistic targets required robust baselines, value stream mapping, and segmentation by worker type, order complexity, and season. Sites that made performance visible and linked it to simple team incentives doubled pick rate over periods of six to twenty-four months while controlling overtime and maintaining safety. Future-ready operations increasingly used WMS, digital twins, and analytics to tune slotting, pick paths, and workforce deployment in near real time.
Design and technology choices had strong cost and flexibility implications. Manual and semi-automated solutions offered lower capital expenditure and easier reconfiguration, while goods-to-person, robotics, and advanced picking technologies delivered higher throughput and lower cost per pick when volumes justified investment. Practical implementation demanded phased rollouts, pilot zones, and parallel process refinement, including training, ergonomic improvements, and predictive maintenance to protect uptime.
A balanced roadmap combined quick wins, such as layout tweaks and batch or zone picking, with medium-term WMS optimization and long-term automation options. Operations that continuously revalidated KPIs, reviewed workforce mix, and refreshed layout for changing demand maintained 80–90% performance retention during peaks. Aligning design decisions, numeric targets, and technology capabilities created a resilient picking system that scaled with business growth while preserving accuracy, safety, and unit cost discipline. For facilities looking to enhance their picking efficiency, tools like the semi electric order picker, warehouse order picker, and order picking machines can play a pivotal role.