Warehouse leaders who ask “what is pick rate warehouse?” focus on a core productivity KPI that links engineering design with operational performance. This article defines pick rate and related warehouse KPIs, explains how to measure and benchmark them, and shows how to engineer higher throughput without sacrificing accuracy or safety. You will see how layout, process design, and technologies such as WMS, scanning, automation, and digital twins influence warehouse order picker performance, including picks per hour, lines per hour, and orders per hour. Finally, the article summarizes how to embed pick rate KPIs into a continuous improvement roadmap so your operation stays competitive as order profiles and customer expectations evolve.
Defining Pick Rate And Core Warehouse KPIs
In warehouse engineering, the answer to “what is pick rate warehouse” starts with clear KPI definitions. Pick rate described how efficiently a site converted labor hours into correctly picked items, lines, or orders. Engineers linked this KPI with other warehouse metrics to understand true capacity, constraints, and cost-to-serve. A precise definition avoided misleading comparisons between different facilities, order profiles, or technologies.
What Pick Rate Measures And Why It Matters
Pick rate measured how fast operators converted pick tasks into physical product movements. At its simplest, it tracked items picked from storage locations per unit time, usually per labor hour. This KPI directly reflected order fulfillment efficiency and labor productivity. Higher sustainable pick rates, at a given accuracy level, reduced order cycle time and labor cost per order. From a systems perspective, pick rate acted as a throughput indicator for the picking subsystem in the end-to-end material flow. It also served as an early warning signal for layout problems, poor slotting, or inadequate training. When engineers evaluated what is pick rate warehouse wide, they also considered context such as SKU mix, order size, and handling method. Without that context, headline numbers risked driving unsafe speeds or excessive errors.
Standard Formulas: Picks, Lines, And Orders Per Hour
Engineers typically used three related measures: picks per hour, lines per hour, and orders per hour. The base formula for item-level performance was: Pick rate (picks/hour) = Total items picked ÷ Total direct picking hours. Lines per hour used the same structure but counted order lines instead of items, which suited environments with variable quantities per line. Orders per hour measured completed customer orders per labor hour and aligned well with service-level and capacity planning. Facilities compared these metrics against internal history and external benchmarks, such as 60–80 picks/hour for simple cart picking or 300–500 picks/hour for goods-to-person systems. When reporting what is pick rate warehouse management cared about, engineers specified which unit they used and which activities they included in “picking hours” (for example excluding meetings or indirect tasks) to keep calculations consistent and auditable.
Balancing Speed, Accuracy, Safety, And Cost
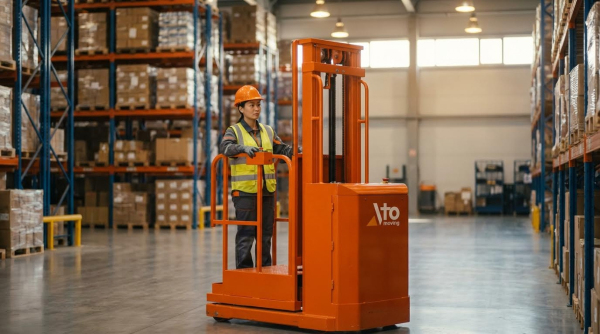
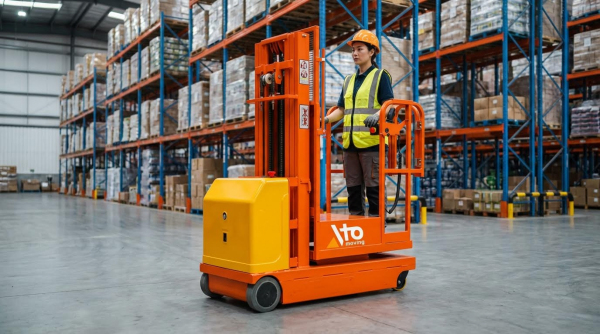
A narrow focus on higher pick rate usually created hidden risks. As operators pushed speed, error rates tended to rise, which increased rework, returns, and customer dissatisfaction. From an engineering viewpoint, the effective pick rate had to be adjusted for accuracy, using metrics like error-free lines per hour or perfect orders per hour. Safety constraints also limited sustainable pick rate, especially where operators walked long distances, handled heavy loads, or worked at height. Standards and regulations required ergonomic limits and safe travel speeds for trucks and semi electric order picker. Total cost per line provided the balancing KPI that combined labor, rework, damage, and overtime into a single economic view. A mature answer to what is pick rate warehouse teams should target therefore described an optimized operating point, not the absolute maximum speed. This point delivered stable throughput with acceptable risk, controlled cost, and reliable customer service. For instance, using advanced order picking machines or tools like an aerial platform could enhance both safety and efficiency.
How To Measure And Benchmark Pick Rate

When operations teams ask “what is pick rate warehouse managers should target,” they need consistent measurement and structured benchmarking. This section explains how to capture reliable pick data, analyze it at different aggregation levels, and compare performance against internal history and external standards. Engineers and industrial managers can then decide whether manual, semi electric order picker, or automated picking methods deliver the required throughput and service levels.
Data Collection, Normalization, And Time Standards
Accurate answers to “what is pick rate warehouse performance really delivering” start with disciplined data collection. Capture total items picked, lines, and orders, together with start–stop timestamps for each picking task. Use a Warehouse Management System or time-stamped RF / scanning events to avoid manual logs, which often contain gaps and rounding errors. Normalize data by excluding breaks, meetings, and non-picking tasks so that Pick Rate (picks per hour) = Total Items Picked ÷ Net Picking Hours. Define standard time elements, such as travel, search, pick, confirm, and exception handling, so engineers can compare different zones and processes on a like-for-like basis. Classify records by SKU family, storage type, and picking method to avoid mixing simple carton picks with fragile or hazardous handling that naturally runs slower.
Individual, Team, And Time-Based Performance Analysis
Once the base data is clean, analyze pick rate at individual, team, and temporal levels. Individual pick rates highlight top performers and operators who might need training, ergonomic adjustments, or better coaching. Team-level metrics show whether a cell, shift, or zone configuration works as a system, which is critical when orders require collaboration across areas. Time-based analysis by hour, shift, day of week, and season reveals peaks and troughs in “what is pick rate warehouse output” under different load conditions. Engineers can correlate drops in pick rate with factors such as congestion, replenishment delays, or fatigue, then redesign staffing patterns, break schedules, and replenishment windows. Always pair pick rate with accuracy and safety indicators to prevent speed-only optimization.
Internal Baselines Versus Industry Benchmarks
Internal baselines answer what is pick rate warehouse teams currently achieve under real constraints. Use at least several weeks of stable operations to calculate average, median, and percentile pick rates for items, lines, and orders per hour. Segment results by picking method and order profile, since a high-SKU e-commerce environment behaves very differently from a low-SKU bulk operation. Industry benchmarks then provide an external reference: typical item-based pick rates ranged around 70 picks per hour, while engineered systems such as goods-to-person historically reached 300–500 picks per hour. Compare your baselines only with relevant peer processes, for example batch picking to batch benchmarks or zone picking to zone figures. Use the gap analysis to set staged improvement targets rather than jumping directly to best-in-class values that ignore layout, mix, or labor constraints.
Comparing Manual, Semi-Automated, And Automated Methods
To decide between manual, semi-automated, and automated solutions, engineers should compare normalized pick rate, accuracy, and cost per line. Manual picking with paper or RF typically delivered 60–80 items per hour in straightforward environments, with higher labor variability. Semi-automated approaches, such as order picking machines, voice-directed systems, or cart-based batch picking, often increased throughput into the 100–300 picks per hour range while improving confirmation accuracy. Fully automated or goods-to-person systems historically achieved 300–500 items per hour per workstation by eliminating most walking and optimizing sequence. When evaluating “what is pick rate warehouse technology can realistically deliver,” recalculate pick rate after each process or equipment change and compare against the pre-change baseline. Include supporting activities such as replenishment and exception handling so that the comparison reflects system-level performance, not just the speed of a single station.
Engineering Tactics To Improve Pick Rate
Engineering tactics translate the abstract concept of “what is pick rate warehouse” into concrete design and process decisions. This section focuses on how layout, process engineering, and technology choices change picks per hour without sacrificing accuracy or safety.
Layout, Slotting, And Travel Distance Optimization
In a warehouse, pick rate depends heavily on how far and how often operators walk. Engineering the layout starts with mapping current pick paths and quantifying travel time as a percentage of total pick time. Facilities that reduced average walking distance per line typically increased pick rate by 20–40%. Place the highest-velocity SKUs in “golden zones” between waist and shoulder height and as close as possible to packing or consolidation areas. Use ABC slotting to position A-items on the shortest paths and near cross-aisles, while pushing C-items to more remote or higher storage. Standardize aisle widths for the equipment in use and minimize dead-end aisles that force backtracking. When asking “what is pick rate warehouse optimization in practice,” the answer often starts with travel distance heatmaps and re-slotting based on measured item velocity and order profiles.
Process Design, SOPs, And Lean Waste Reduction
Process engineering focuses on how operators execute each pick, from reading an assignment to confirming completion. Documented Standard Operating Procedures (SOPs) create a baseline so that pick rate comparisons across shifts and workers remain valid. Lean methods classify non-value-added actions such as unnecessary motion, waiting for replenishment, or re-handling totes as waste. Time-and-motion studies often show that indirect tasks consume more time than the physical pick itself. To improve “what is pick rate warehouse performance” at process level, define clear picking strategies by order profile: single-order picking for small, urgent orders, batch or cluster picking for high-volume small lines, and zone picking for large facilities. Introduce visual work instructions and checklists to reduce cognitive load and decision time. Align replenishment processes so pickers rarely encounter empty locations, which otherwise forces delays and rework. With stable SOPs, continuous improvement tools like PDCA or Kaizen events can systematically raise lines per hour while maintaining picking accuracy KPIs.
WMS, Scanning, And Advanced Picking Technologies
Digital systems determine how information flows to the picker and how confirmations return to the Warehouse Management System (WMS). A well-configured WMS allocates work, optimizes pick paths, enforces location and unit-of-measure consistency, and provides real-time visibility of pick rate at worker, zone, and shift level. Barcode or RFID scanning reduces search time and mis-picks by validating that the operator is at the correct location and handling the correct SKU before confirmation. Advanced picking technologies such as order picking machines, put-to-light, and voice-directed picking further compress decision and confirmation time. Pick-to-light systems guide operators with location-mounted lights and quantity displays, which typically increase picks per hour compared with paper or handheld lists. Voice systems free the operator’s hands and eyes, improving ergonomics and allowing higher sustained pick rates over long shifts. For the query “what is pick rate warehouse technology impact,” the measurable answer is higher picks per hour combined with better traceability, fewer errors, and richer performance data for benchmarking.
Automation, Cobots, And Digital Twin Optimization
Automation changes the physical and informational flow rather than only optimizing human movement. Automated storage and retrieval or goods-to-person systems bring items to static pick stations, which can push pick rates into the 300–500 picks per hour range for suitable SKU profiles. Collaborative robots (cobots) and autonomous mobile robots (AMRs) can handle transport tasks so human pickers focus on value-added identification and confirmation. This separation of tasks reduces fatigue and stabilizes pick rate across the shift. A digital twin of the warehouse models racks, equipment, order arrival patterns, and labor rules in software. Engineers can run scenarios that answer “what is pick rate warehouse potential” under different layouts, batching rules, or automation levels without disrupting live operations. By simulating peak seasons, slotting variants, or additional robots, the digital twin helps select configurations that maximize picks per hour while respecting constraints such as safety clearances, ergonomic limits, and capital budgets.
Summary: Using Pick Rate KPIs For Continuous Improvement

Warehouse leaders who ask “what is pick rate warehouse?” usually want a practical lever for continuous improvement, not just a definition. Pick rate described how many items or order lines operators picked per hour, and it directly reflected order fulfilment efficiency, labour utilisation, and service levels. When engineers embedded this KPI into daily management, they gained a quantitative view of layout quality, process design, technology effectiveness, and workforce performance.
Technically, robust pick rate management started with clean data and clear scope. Sites defined whether they measured items, lines, or complete orders per hour, then normalised for activities such as travel, replenishment, and breaks. They compared current values against internal baselines and external benchmarks, for example 70 items per hour as a broad average, or method-specific ranges such as 100–150 picks per hour for batch picking and up to 300–500 picks per hour for goods-to-person systems. This benchmarking step showed the realistic improvement gap before capital or organisational changes.
From an engineering perspective, the most sustainable gains came from an integrated approach. Layout optimisation reduced travel distance, while structured slotting placed fast movers in ergonomic “golden zones” to lift both pick rate and accuracy. Lean process design removed non-value-adding steps, and a well-configured WMS with scanning or pick-to-light reduced search time and rework. Automation, cobots, and digital twins further increased throughput by improving sequencing, balancing workloads, and allowing safe experiments on virtual models before physical changes.
However, the metric “what is pick rate warehouse” never stood alone. High picks per hour with poor accuracy, unsafe behaviour, or operator fatigue degraded total system performance and increased cost-to-serve. Leading facilities therefore tracked pick rate together with picking accuracy rate, order cycle time, and incident statistics, and they tied improvement to training, ergonomic design, and transparent, fair incentive schemes. Used this way, pick rate KPIs became the backbone of a continuous improvement loop: measure, analyse, redesign, simulate where possible, implement, and re-measure. Facilities that treated pick rate as an evolving system property rather than a fixed target typically achieved higher, more stable productivity over time while remaining flexible for future technologies and changing order profiles.