Order picking in logistics is the engineering heart of warehouse performance, tying together layout, methods, KPIs, and semi electric order picker into one system. This guide walks through how to design, measure, and upgrade picking so you cut travel time, boost accuracy, and match technology to your actual order profiles.
Order Picking Fundamentals And Core Methods
Order picking in logistics starts with understanding order profiles, then choosing matching picking methods, layouts, and storage policies that minimize travel and errors while protecting ergonomics and throughput.
This section builds the engineering foundation: how demand patterns, workflows, and zoning decisions drive picker routing, batching, and ultimately performance.
Order profiles and demand patterns
Order profiles and demand patterns describe what is picked, how often, and in what combinations, and they dictate almost every design choice in order picking in logistics.
Before choosing equipment or software, you need a clear picture of order size, line count, SKU mix, and time variability.
- Single-line, single-unit orders: One SKU, one piece – Ideal for e‑commerce “each picking” and fast conveyor or goods-to-person designs.
- Multi-line, small orders: Several SKUs, low total units – Best for batch or zone picking to cut walking distance.
- Multi-carton or pallet orders: Many lines and cases – Suited to manual pallet jack, reach trucks, and case/pallet picking zones.
- High-SKU, low-volume profile: Many SKUs, few hits per SKU – Pushes you toward random/mixed storage and strong WMS support.
- Low-SKU, high-volume profile: Few SKUs, many hits per SKU – Supports dense storage, forward pick faces, and flow rack.
- Stable demand: Predictable weekly pattern – Allows long-lived slotting and fixed zones.
- Seasonal or volatile demand: Peaks and promotions – Requires re-slotting and flexible labor/equipment planning.
How to quickly profile your orders
Export 3–6 months of order history. For each order, calculate: lines per order, units per line, total units, cube per order, and shipping service level. Then segment by channel (e‑commerce, retail replenishment, spare parts) and time of day. This data will steer you toward the right picking method and layout.
Demand patterns also drive picker workload and travel share. In many warehouses, 40–60% of a picker’s shift is spent walking rather than picking, and optimized layouts aim to cut this to 25–35% travel time by engineering better slotting and routing.
💡 Field Engineer’s Note: When profiling orders, always overlay them on your floor map. A SKU with only 20 lines per day can still be a travel hotspot if its picks are scattered across 100 m of aisle. Distance, not only volume, should drive “A‑class” decisions.
Main picking strategies and workflows
Main picking strategies in order picking in logistics fall into a few proven patterns: single-order, batch, zone, and wave/hybrid methods, each tuned to specific order profiles and travel constraints.
Most performance gains come from reducing travel through smarter batching and routing, not from making people walk faster.
| Picking Strategy | Core Idea | Best For… | Operational Impact |
|---|---|---|---|
| Single-order (discrete) picking | One picker completes one order end-to-end. | Low volume, simple orders, start-up sites. | Low complexity but high travel per order; easy to manage and train. |
| Batch picking | Picker collects multiple orders in one tour. | Many small orders with overlapping SKUs. | Reduces trips; constrained by cart/container capacity and sort capacity. |
| Zone picking | Warehouse split into zones; each picker stays in one zone. | Large sites, high SKU counts, long aisles. | Cuts walking per picker; needs handoff or conveyor between zones. |
| Wave picking | Orders released in timed waves by carrier/route/cutoff. | High-volume DCs with strict shipping windows. | Aligns labor and dock use; risk of congestion during waves. |
| Cluster picking | Picker serves multiple orders at once at the pick face (e.g., cart with multiple totes). | E‑commerce each-pick with many single lines. | High pick density; needs clear visual or system guidance to avoid mis-sorts. |
Two engineering levers dominate these workflows: routing and batching. Picker routing seeks the shortest feasible path through a zone; travel accounts for roughly 50% of total picking time so routing logic is a primary KPI driver. Order batching groups multiple orders so one tour feeds several customers, cutting empty travel.
- Picker routing optimization: Generate picklists and paths that minimize total walking distance, including the trip from and back to the depot by solving the Picker Routing Problem (PRP).
- Order batching strategy: Group compatible orders to reduce tours; advanced joint selection and batching models have improved solution quality by up to 70.9% in large-scale tests.
- Order selection impact: Intentionally skipping some orders in a batch planning cycle can cut pick cost per item by up to 72.6% by forming denser, more efficient pick tours.
All batch-based workflows are constrained by what the picker can physically handle.
- Batch order limit constraint: Maximum orders per batch are capped by the number of cells in manual sort shelves or chutes in automated sorters to avoid overloading downstream sortation.
- Picklist volume limit constraint: Total cube on a picklist must not exceed the cart, trolley, or pallet capacity so the route stays physically feasible.
Distance Greedy Algorithm (DGA) in plain language
The Distance Greedy Algorithm picks orders for a batch by checking how close their items are to each other. It tries to minimize added walking distance each time it adds an order. It delivers roughly twice the quality of simpler randomized methods but with O(n⁴) complexity, so it fits offline planning better than live, real-time batching on very large instances.
💡 Field Engineer’s Note: Do not chase “perfect” routes at the expense of usability. A slightly longer S-shape pattern that pickers remember and follow is often better than a mathematically optimal path that confuses new staff and increases error risk.
Layout, zoning, and storage policies

Layout, zoning, and storage policies translate your order profile into concrete aisle geometry, depot placement, and slotting rules that cut travel distance and congestion in order picking in logistics.
Well-engineered facilities combine macro layout (U/I/L shape), zone design, and storage rules like mixed-shelves to balance density, speed, and accuracy.
| Design Element | Typical Options | Engineering Focus | Operational Impact |
|---|---|---|---|
| Overall building flow | U-shaped, I-shaped, L-shaped layouts | Dock positions vs. storage; cross-dock vs. deep storage. | Controls travel from receiving to shipping and congestion at docks based on dock capacities and throughput. |
| Zones | By temperature, velocity, product family, or customer | Each zone with parallel aisles and one depot. | Shorter tours per picker; easier workload balancing and specialization since pick tours start/end at the zone depot. |
| Slotting policy | Fixed, random, or class-based (A/B/C) | Place high-velocity SKUs near packing and at ergonomic heights. | Reduces travel and strain; supports higher picks per hour with quarterly re-slotting audits. |
| Storage policy | Dedicated, random, mixed-shelves | Balance space utilization vs. search complexity. | Mixed-shelves spreads SKUs across locations to use space and reduce congestion, but needs strong WMS and item assignment logic for good picklist creation. |
In a typical zoned layout, each zone contains parallel racks and a single depot in the center. Pick tours remain inside that zone and start and end at the depot to keep routing local and predictable which simplifies both batching and labor planning.
- High-velocity SKUs: Place within about 10–30 m of packing or consolidation to minimize walk time on the most frequent picks.
- Heavy or bulky items: Keep between roughly 500–1,500 mm pick height – reduces bending and overhead lifting risk.
- Complementary SKUs: Group items often ordered together – shortens micro-travel inside a bay.
- Re-slotting cadence: Review A/B/C classes at least quarterly – keeps layout aligned with changing demand and promotions according to best-practice guides.
Mixed-shelves storage in practice
Under a mixed-shelves policy, the same SKU can sit in multiple arbitrary locations. This increases space utilization and spreads traffic, which helps in narrow aisles. The trade-off is higher dependence on WMS accuracy and routing logic because human “memory maps” of where items live become unreliable so scanning discipline and inventory control must be tight.
💡 Field Engineer’s Note: When you redraw zones or re-slot, walk the longest current pick path with a measuring wheel. If that path is over 150–200 m for a typical multi-line order, you almost always have a layout or zoning problem, not a labor problem.
Engineering Order Picking For Performance KPIs
Engineering-focused design turns order picking in logistics from a labor sink into a measurable, optimizable flow tied to hard KPIs. This section links routing, batching, and automation choices directly to travel time, accuracy, and cost per pick.
Travel time, routing, and batching optimization
Travel time optimization starts with engineering picker routes, zones, and batches so that every meter walked produces maximum picks. In a typical warehouse, travel easily consumes 40–60% of picking time, so this is the primary lever.
- Picker routing: Design the shortest feasible path through a zone – cuts non‑value walking and cycle time.
- Batching: Combine compatible orders into one tour – fewer trips to the same locations.
- Zoning: Keep pickers in compact areas – reduces route length and congestion.
- Capacity constraints: Respect cart, tote, and sorter limits – prevents rework and unsafe overloading.
Picker routing optimization formalizes the problem of finding the shortest tour that collects all items in a zone and returns to the depot. Travel time accounts for around 50% of the picking process duration, so even small distance reductions have an outsized impact on throughput and cost per pick. Research on the Picker Routing Problem (PRP) shows that optimizing the ordered picklist to minimize walking distance is one of the most effective levers available.
Order batching groups multiple customer orders into a single pick tour to reduce the number of depot departures and aisle entries. In large facilities, the Joint Order Selection, Allocation, Batching, and Picking Problem (JOSABPP) extends this by allowing only a subset of orders to be batched based on item locations and goals. This approach has improved solution quality by up to 70.9%, and selective order inclusion has cut picklist cost per item by up to 72.6% versus naïve batching of all available orders. The same study underlines that “which orders you batch” matters as much as “how you batch.”
Effective zoning divides the warehouse into discrete areas with a single depot and parallel aisles. Each pick tour starts and ends at the zone depot and remains within that zone, which enables short routes and clear accountability. Zoning also supports specialization: some pickers handle small‑parts fast movers, others handle bulky or hazardous SKUs, reducing training complexity and safety risk. Mixed‑shelves storage policies, where the same SKU can be stored at multiple arbitrary locations, further distribute traffic and reduce congestion, but they require robust assignment logic so that picklists still yield short, conflict‑free routes. Evidence on mixed-shelves policies shows better space utilization but higher reliance on intelligent WMS algorithms.
Engineering constraints cap how aggressive batching and routing can be. Batch order limits are set by the number of cells in manual sort shelves or chutes in sorters, while picklist volume is limited by the physical capacity of the picking container or cart. Ignoring these limits leads to unsafe stacking, extra consolidation passes, and broken flow. Algorithms like the Distance Greedy Algorithm (DGA) select orders based on inter‑item distance to minimize travel; although DGA is computationally heavy (O(n^4)), it consistently outperforms simpler heuristics, often producing solutions roughly twice as efficient as randomized approaches. This highlights the benefit of stronger optimization logic when route patterns are stable enough to justify computation.
| Design Lever | Typical Range / Constraint | What You Engineer | Operational Impact |
|---|---|---|---|
| Travel time share | 40–60% of shift; target 25–35% | Routing rules, slotting, zoning | More picks per hour with same labor; lower fatigue |
| Batch size (orders) | Capped by sorter cells or cart slots | Max orders per batch per cart/sorter | Avoids overfilled carts and sortation bottlenecks |
| Picklist volume | ≤ container capacity (tote, pallet) | Max m³ or item count per tour | Prevents repacking and unsafe stacking |
| Zoning | 1 depot per zone; parallel aisles | Zone boundaries and SKU families | Shorter routes, easier supervision |
| Order selection | Subset of pool | Rules for which orders enter batch | Up to 70%+ lower cost per item vs naïve batching |
💡 Field Engineer’s Note: When you push batching too hard in a manual-cart operation, the first symptom is not “better productivity” but overloaded carts that are hard to steer, especially on slightly uneven floors or ramps. Always size batch limits from the cart’s safe load and stopping distance, then let the algorithm work inside that envelope.
How to start measuring travel time and routing losses
Start by sampling 10–20 full pick tours per shift. Record total tour time, active pick time, and distance walked (pedometer or truck odometer). If travel exceeds 35% of tour time, prioritize re‑slotting fast movers near depots and implementing simple aisle routing rules before jumping to complex algorithms.
Core KPIs, benchmarks, and target ranges
Core picking KPIs translate routing and batching decisions into measurable performance, with benchmarks for accuracy, speed, utilization, and cost that you can engineer against. You design processes and equipment so the physics support these numbers every shift.
Best‑in‑class order picking in logistics runs with extremely high accuracy and on‑time performance. On‑time shipment rates of ≥99.5% are common in top operations, meaning almost every order leaves when promised. Picking accuracy at or above 99.68% has been reported for leading sites, although sustaining levels near 99.9% is challenging and requires tight process control. Benchmark studies also show dock‑to‑stock cycle times under 3.5 hours for inbound, which indirectly supports picking by keeping inventory records current and reducing stockouts.
Throughput KPIs such as picks per hour (PPH), lines per hour (LPH), and orders per hour (OPH) quantify how well routing, batching, and equipment choices convert labor hours into shipped volume. Manual operations typically achieve 80–120 PPH, while optimized and automated sites can reach 200–300 PPH. Experienced pickers usually process 60–85 LPH, whereas new staff remain around 35–50 LPH until fully trained. Single‑line e‑commerce orders may see 40–60 OPH, while complex multi‑line B2B orders often stay below 20 OPH. These benchmarks give realistic targets when sizing labor and equipment.
Accuracy and quality metrics sit alongside speed. Manual picking often runs between 97% and 99% accuracy, while technologies like pick‑to‑light and voice can push performance above 99.5%. Best‑in‑class operations achieve at least 99.9% accuracy, which sharply reduces returns, rework, and customer complaints. Damage rate is another critical KPI; robust operations keep damage below 0.5% of handled units, while values above 1% usually indicate issues with equipment condition, training, packaging design, or ergonomics. Data across facilities confirms that incremental accuracy gains at these levels pay back via avoided downstream costs.
From a cost and capacity standpoint, cost per pick and utilization metrics tie engineering decisions directly to the P&L. Manual environments often incur USD 0.75–1.25 per pick, semi‑automated systems run around USD 0.45–0.75, and highly automated sites can drop to USD 0.25–0.45 per pick. Travel time percentage is another diagnostic KPI: poorly designed layouts see 40–60% of a picker’s shift spent traveling, while optimized operations target 25–35%. Picker utilization typically aims for 75–85% in standard sites and can reach 85–95% in tightly engineered operations without compromising safety. Storage location utilization ideally stays between 80% and 90%, while overall warehouse capacity usage around 80–92% with peaks near 95–100% indicates well‑sized facilities that avoid chronic congestion. These ranges are a useful design envelope when planning racking, MHE, and staffing.
| KPI | Typical / Best-in-Class Value | What Drives It | Operational Impact |
|---|---|---|---|
| On-time shipments | ≥99.5% | Capacity, cut-off discipline, routing | Customer promise reliability |
| Picking accuracy | Manual: 97–99%; Best-in-class: ≥99.9% | Process design, tech aids, training | Fewer returns and rework |
| Dock-to-stock | <3.5 hours | Receiving and put-away flow | Inventory availability for picking |
| Picks per hour (PPH) | Manual: 80–120; Automated: 200–300 | Travel share, batch size, equipment | Labor needed for peak volume |
| Damage rate | <0.5% (warning if >1%) | Equipment, packaging, ergonomics | Product loss and safety risk |
| Cost per pick | Manual: 0.75–1.25 USD; Highly automated: 0.25–0.45 USD | Labor efficiency, automation level | Unit fulfillment cost and margins |
| Travel time share | Bad: 40–60%; Target: 25–35% | Layout, slotting, routing | Picker fatigue and productivity |
| Picker utilization | 75–85% (standard); 85–95% (engineered) | Scheduling, balancing, idle time | Labor ROI vs. burnout risk |
| Storage utilization | 80–90% of locations | Slotting, replenishment, SKU mix | Balance between density and access |
- Define KPI targets first: Set numeric goals by process and shift – so every engineering change has a measurable aim.
- Segment by profile: Track KPIs by order type (e‑com, B2B, bulky) – avoids averaging away real issues.
- Tie KPIs to layout: Link bad metrics to specific zones and aisles – guides re‑slotting and routing projects.
💡 Field Engineer’s Note: When you see great PPH but rising damage or ergonomic incidents, you are “over‑optimizing” speed. In practice, I always cap utilization and travel targets so pickers can maintain three things together: pace, accuracy, and safe handling posture.
Quick KPI health check for an existing site
If your travel time share is above 40%, accuracy below 99%, and cost per pick above 1.00 USD, you likely have a routing and slotting problem, not just a labor issue. Fix layout and pick paths before adding headcount.
Automation, WMS, and analytics impact
Automation, WMS, and analytics amplify the engineering of order picking in logistics by enforcing optimized routes, guiding pickers, and continuously tuning slotting and batching. They convert one‑time layout designs into self‑correcting systems.
A capable Warehouse Management System (WMS) is the control layer for advanced picking strategies. It must support dynamic picklist generation, real‑time inventory visibility, and labor tracking to enable batch, wave, and zone picking. Industry guidance emphasizes that accurate, timely data is non‑negotiable for routing and batching algorithms to work. Analytics built on WMS data can map actual picker routes, identify “hot spots” of repeated travel, and highlight zones where re‑slotting or re‑batching would cut wasted motion.
Automation significantly shifts the KPI envelope. Automated storage and retrieval systems (AS/RS) with shuttles can deliver 3–5 times faster order retrieval and achieve 50–70% space savings compared to conventional shelving. Performance audits have shown up to a threefold increase in velocity over five years, a 50% reduction in order turnaround time, and an 85% reduction in mean error rates after AS/RS implementation. Reports on automated cells also show that one automated cell can replace the workload of 2–4 full‑time employees, cutting annual labor from around USD 120,000 to roughly USD 30,000 and reducing error‑related costs from USD 15,000 to USD 1,500.
Autonomous mobile robots (AMRs) and AGVs reduce walking distances by roughly 40–60% by bringing carts or totes to pickers, turning them from “walk and search” workers into “pick and pack at a station” operators. In controlled tests, manual cart picking took about 17 minutes 35 seconds and 621 steps per task, while AMR‑assisted picking reduced this to 10 minutes 59 seconds and 276 steps. For experienced workers, the gap widened further to 13 minutes 54 seconds manually versus 6 minutes 59 seconds with
Matching Equipment And Technology To Order Profiles
Matching equipment to order profiles in order picking in logistics means engineering a toolkit that fits SKU velocity, line count, and handling risk, instead of buying generic “fast” gear. The right mix cuts travel, errors, and cost per pick.
In this section we connect order profiles (single-line e‑commerce, multi-line B2B, bulky items, micro-orders) to specific equipment and automation layers. The goal is to show where manual tools still win, and where AGVs, AMRs, AS/RS, and robots deliver step-change performance.
Manual and mechanized picking equipment
Manual and mechanized equipment remain the backbone for many order picking in logistics operations, especially with variable demand and mixed SKUs. The key is to align each tool with pick density, load mass, and travel distance.
Instead of a long narrative, the table below maps common order profiles to practical equipment choices and their operational impact.
| Order / SKU Profile | Typical Picks & Accuracy | Best-Fit Manual / Mechanized Equipment | Operational Impact |
|---|---|---|---|
| Low-volume, high-mix (spare parts, MRO) | 60–100 picks/hour, ≥97–99% accuracy in manual setups reference | Picking carts, manual pallet jack, small-shelf trolleys | Low CAPEX; ideal for aisles ≥1.8–2.2 m; flexible for frequent re-slotting |
| Medium-volume, small items, short travel | 80–120 picks/hour with good layout reference | Cart picking with totes, conveyor-fed zones, low-lift walkie pallet trucks | Cuts walking share towards 25–35% of shift when slotting is optimized reference |
| High-volume, floor-level case picking | 80–120 picks/hour; damage rate target <0.5% reference | Ride-on pallet trucks, double-pallet handlers, low-level order pickers | Optimized for heavy loads up to pallet capacity; supports long pick aisles with fewer turns |
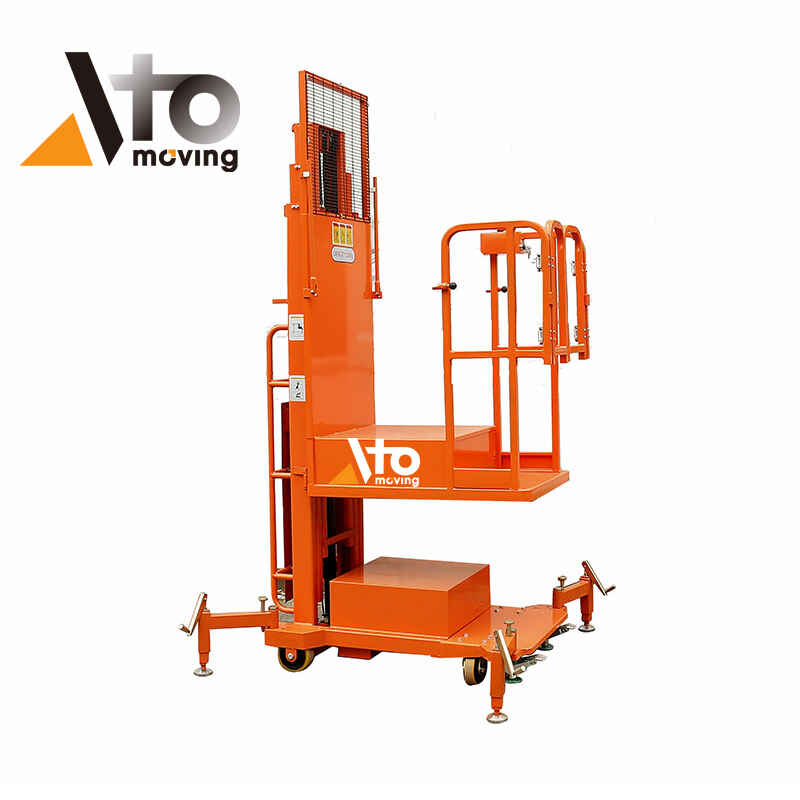
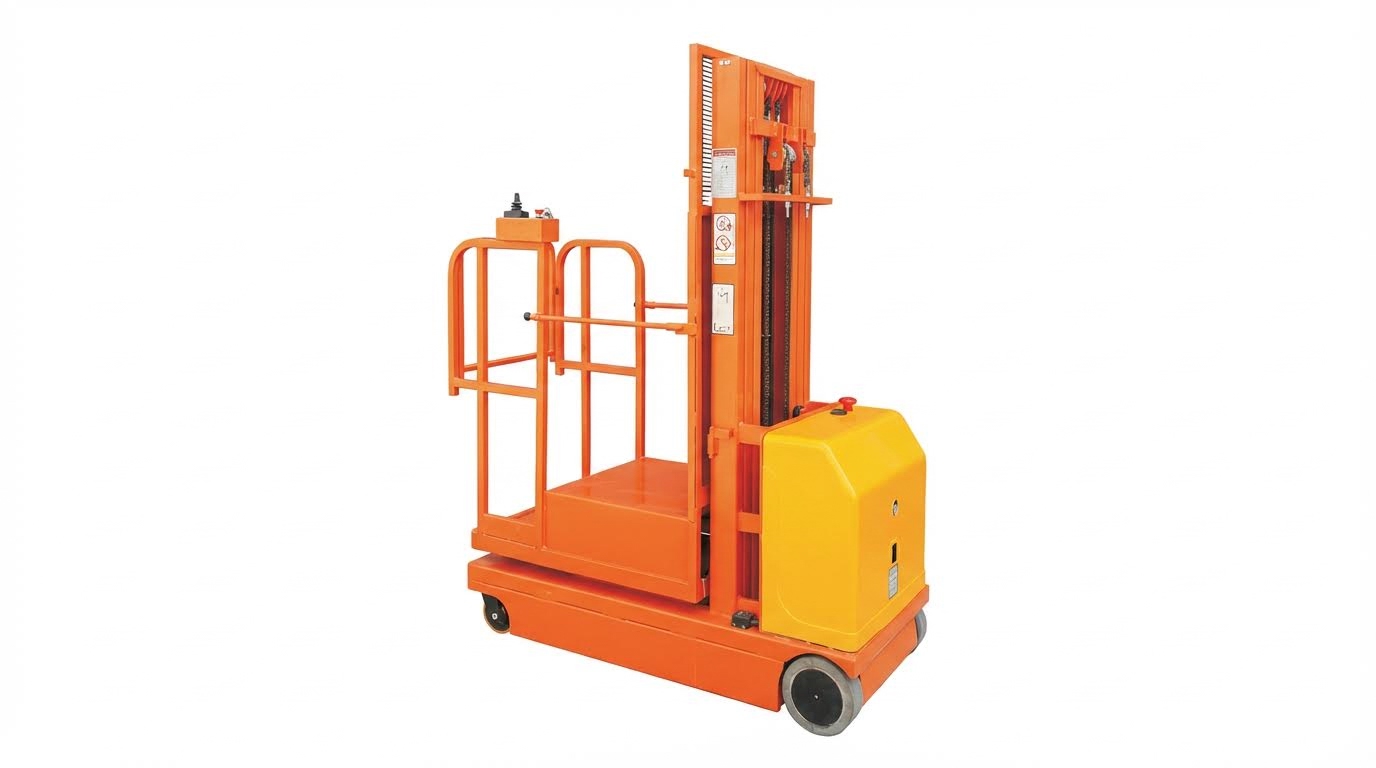
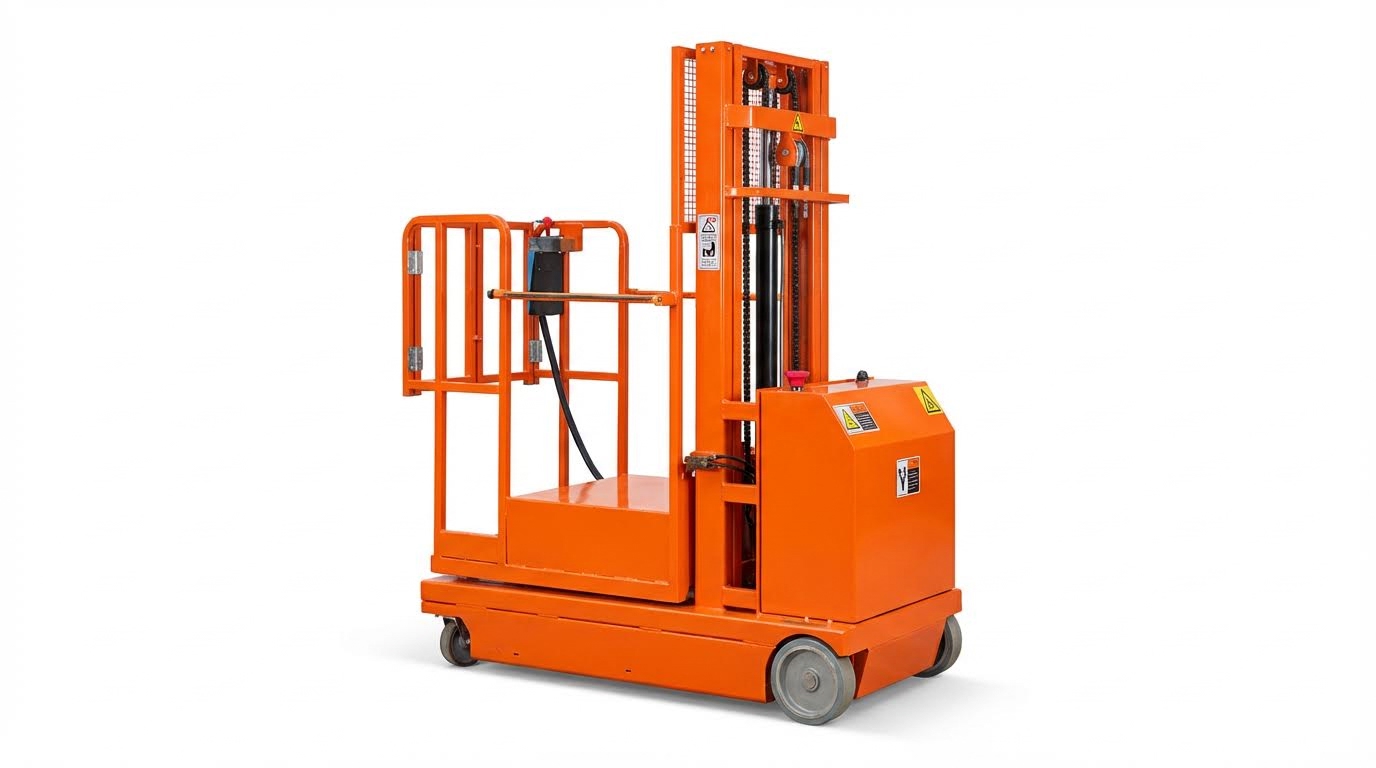
| Medium-height picking (up to ~5–6 m) | Manual pick rates, but constrained by lift/lower time | Mid-level order pickers, small man-up stackers, rolling ladders for low volume | Access to 2–3 beam levels without full AS/RS; needs 2.5–3.0 m aisles depending on truck |
| Bulky / heavy items (≥20–30 kg each) | Lines/hour limited by ergonomics and travel | Counterbalance or reach trucks with forks or clamps, lift tables at pick/pack | Reduces damage and injuries; enforces pallet-height picking between knee and shoulder |
- Picking carts: Best for small, light items – Maximizes SKU variety per tour with low equipment cost.
- Walkie / ride-on pallet trucks: Ideal for case and pallet picks – Increase travel speed and load mass per trip.
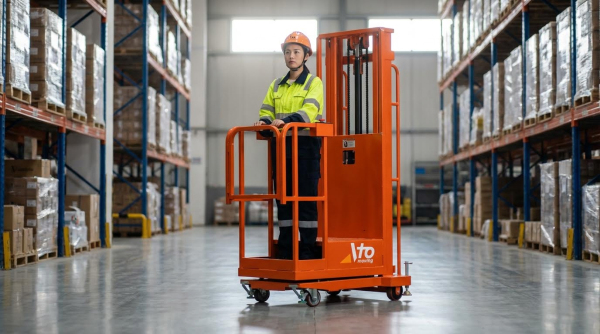
- Low- and mid-level order pickers: Designed for person-up picking – Extend vertical reach without full automation.
- Conveyors feeding pick zones: Support zone or batch picking – Reduce backtracking and manual cart moves.
- Ergonomic aids (lift tables, tilt tables): Keep work between 750–1,200 mm height – Cut damage rate towards <0.5% and protect operators.
How to choose between carts and powered trucks
As a rule of thumb, once average tour distance regularly exceeds 80–100 m and batch weight approaches 150–200 kg, powered pallet trucks or tow tractors start to outperform manual carts in fatigue, speed, and injury risk.
💡 Field Engineer’s Note: When you move from carts to low-level order pickers, watch floor flatness and expansion joints. Small polyurethane drive wheels can “hammer” over joints, shaking operators and loads, especially with 1,000+ kg pallets and long aisles; poor floors quietly drive up damage and maintenance.
AGVs, AMRs, AS/RS, and robotic picking
AGVs, AMRs, AS/RS, and robotic picking transform order picking in logistics by attacking the two biggest wastes: travel time and human error. They suit high-volume, repeatable flows more than sporadic, low-density demand.
The table below compares key automation options using performance ranges from real deployments.
| Technology | Typical Performance | Best-Fit Order / Facility Profile | Operational Impact |
|---|---|---|---|
| AMR-assisted picking (goods-to-person light) | Walking steps per task cut from ~621 to 175–276; task time from ~17.6 min to 7.0–11.0 min reference | Medium–high order volumes, many small lines, existing shelving | Reduces walking distance by 40–60%; shifts labor from “walk and search” to “pick and pack” reference |
| AGVs (tugger or pallet movers) | Replace 2–4 FTE-equivalents per automated cell; large labor savings reference | Stable, repeatable pallet or cart routes between zones and docks | Standardizes internal transport; frees humans for exception handling and fine picking |
| Shuttle-based AS/RS | 3–5× faster order retrieval; 50–70% space savings; up to 50% shorter order turnaround and 85% lower mean error rates reference | Very high SKU and order volumes, tight footprint, predictable flows | Enables true goods-to-person; supports 200–800+ picks/hour per workstation with <0.5% errors reference |
| Robotic piece picking cells | 400–800 picks/hour with error rates below 0.5–0.1% versus manual 100–200 picks/hour reference | High volumes of small, graspable items; long operating hours | Stabilizes accuracy near 99.9%; ideal for night shifts and peak smoothing |
- AMRs: Mobile robots that bring racks, carts, or totes to people – Excellent retrofit path for brownfield sites with 2.0–2.7 m aisles.
- AGVs: Fixed-path or guided vehicles – Best for pallet or cart transfer between pick, buffer, and dock zones.
- AS/RS shuttles: High-density, multi-level storage – Minimize walking and compress storage into high-bay footprints.
- Robotic picking arms: Vision-guided manipulators – Automate the slowest, most repetitive piece-pick tasks.
- Energy systems: AC drives, regenerative braking, lithium-ion batteries – Extend runtime and support opportunity charging in multi-shift sites.
ROI and payback expectations
Automation projects typically calculate ROI as (Annual Savings – Annual Costs) ÷ Investment × 100. Medium-sized systems often see payback in six to eight years, while very large programs can extend towards ten years, driven mainly by labor, accuracy, and space savings reference.
💡 Field Engineer’s Note: Before committing to AMRs or AS/RS, instrument your current operation: measure travel share (often 40–60% of shift time) and true pick accuracy. If your layout and WMS are weak, fix those first; robots will only automate the chaos.
Final Thoughts On Designing Future-Proof Picking Systems
Engineering-led order picking links layout, methods, KPIs, and equipment into one controlled system instead of a loose set of tools. Order profiles define everything first: they drive zoning, slotting, routing rules, and the mix of manual carts, pallet trucks, order pickers, and automation from Atomoving. When you match these elements well, you cut travel time, keep pickers in safe postures, and protect accuracy near benchmark levels.
Routing and batching algorithms only deliver value when you respect physical limits. Aisle geometry, cart capacity, sorter cells, and safe load heights must cap batch sizes and tour volume. Good WMS logic then works inside this envelope to keep travel near 25–35% of shift time and cost per pick within your target band.
Future-proof systems stay flexible. Start with clear KPI targets by order profile, then phase in technology: refine slotting, add mechanized aids, and only then layer AGVs, AMRs, AS/RS, or robots where volume and stability justify them. The best operations review data often, walk the floor, and treat every change as an engineering experiment. That discipline keeps order picking safe, fast, and ready for the next demand shift.
Frequently Asked Questions
What is order picking in logistics?
Order picking in logistics refers to the process of selecting items from their storage locations in a warehouse to fulfill customer orders. This step is crucial as it ensures that the right products are collected accurately and efficiently to meet customer demands within specified timeframes. Warehouse Operations Guide.
What does picking mean in a warehouse?
Picking in a warehouse describes the task of collecting customer orders by removing goods from shelves or storage areas. It is often referred to as “commissioning” and involves gathering items to be sent out for delivery. Fulfillment Glossary.